Final Data Visualization // Visualización de Datos Final
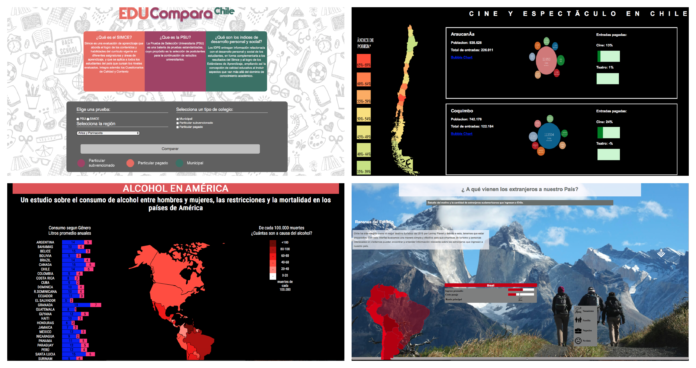
{ENG} The second phase of the course has come to an end! After one month of work, students finally finished their data visualizations. The task was to collect different databases from the open-data institution’s web pages, with different subjects. The goal was to intersect the databases to get new conclusions through the visualization; conclusions that one wouldn’t have got just looking to the raw data.
This was the opportunity for the students to apply all the contents they had learned from the course. Students learned to understand how information is displayed to a user, to use different visual codes in an effective way, prototype, and test interfaces, and to tell a story using real data. They also learned technical skills, specifically programming (Python, HTML & CSS, JavaScript, and libraries like jQuery and d3.js).
{ESP} ¡La segunda fase del curso a terminado! Luego de un mes de arduo trabajo, los estudiantes finalmente terminaron sus visualizaciones de datos. El encargo consistió en recolectar diferentes bases de datos desde páginas de datos abiertos de instituciones, y acerca de diferentes temas. El fin era juntar estas bases de datos para obtener nuevas conclusiones a través de la visualización; conclusiones a las que no se habría llegado al mirar los datos de manera directa.
Esta fue la oportunidad de los estudiantes para aplicar todos los contenidos aprendidos en el curso. Los estudiantes aprendieron a entender cómo la información es mostrada y recibida por el usuario, cómo utilizar diferentes códigos visuales de manera efectiva, prototipar y testear interfaces y cómo contar una historia a través de datos reales. También ganaron habilidades técnicas relacionadas con programación (Python, HTML & CSS, JavaScript y librerías como jQuery y d3.js).